EXHIBIT E-02

PREDICTION LAB · 02:33

AS OF 8/10/26 · DEMO AT web-production-563b7.up.railway.app

FIG 1 · SCREEN CAPTURE · 1920×1080 · 60 FPS · 9,198 FRAMES
CH 01 · THEMES
CHAPTER LOG
  1. 01W-09
  2. 02W-08
  3. 03W-02W-04
  4. 04W-01
  5. 05W-03
  6. 06W-05W-06
  7. 07W-08
  8. 08W-04
  9. 09W-07
  10. 10W-02W-07

EACH ROW CITES THE LEDGER STEPS ITS CHAPTER DEMONSTRATES

  1. W-01

    The studio holds chart and chat together

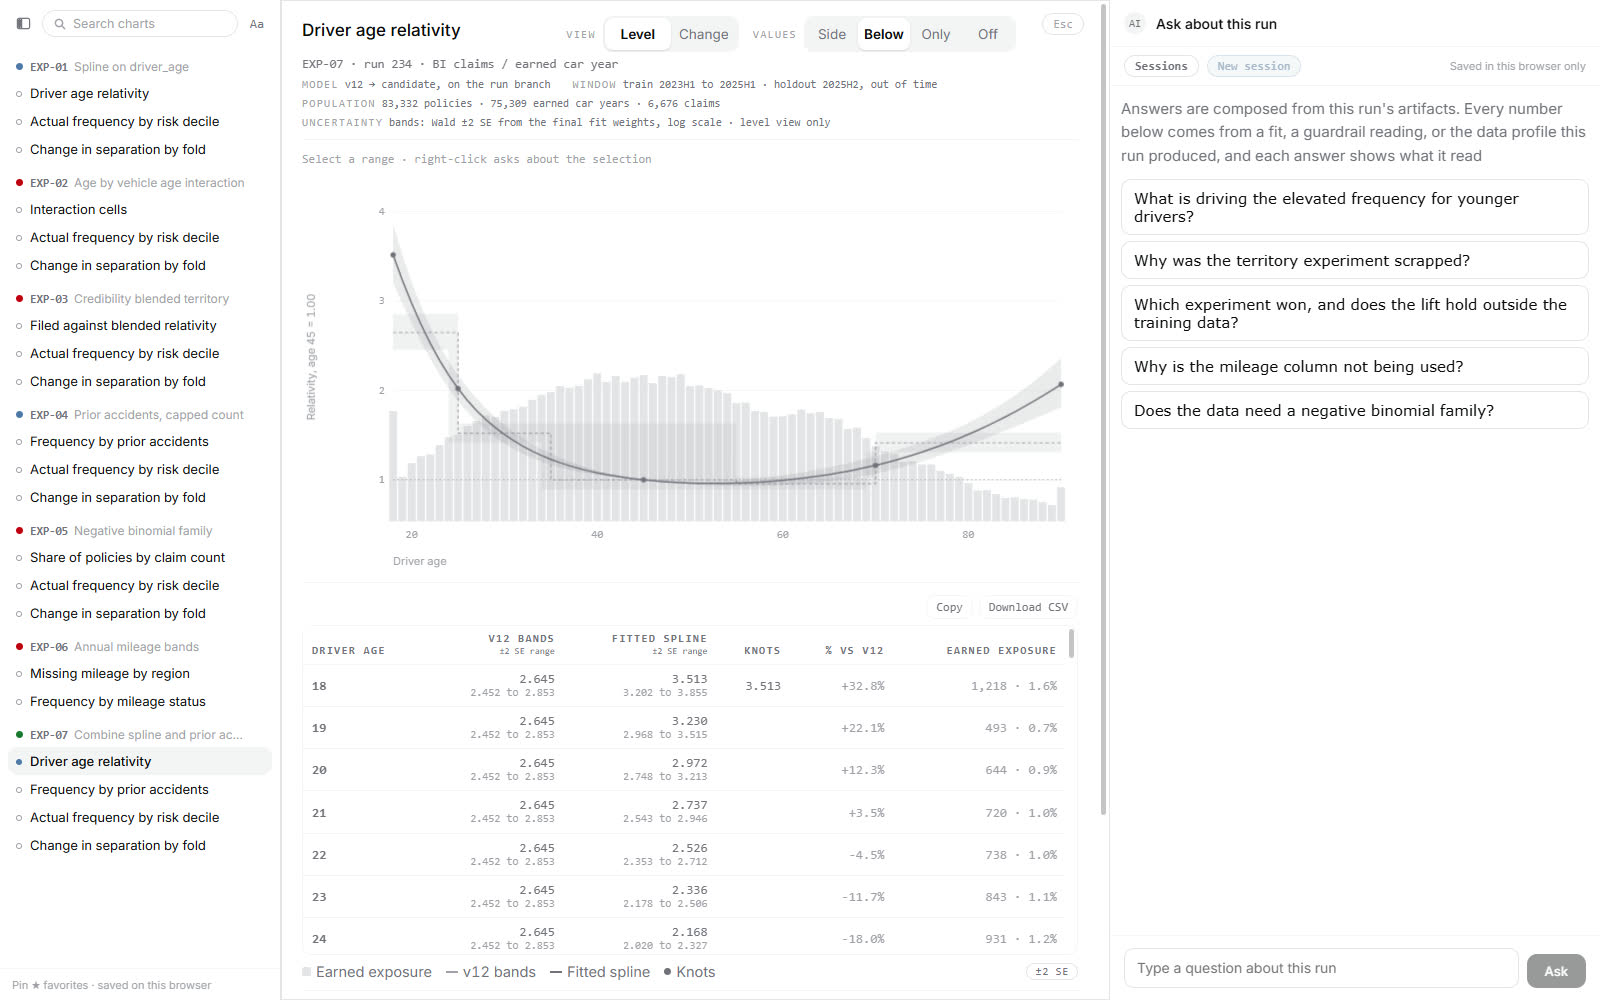
    Chart on the left, the conversation docked on the right. Asking used to open a panel on top of the chart.
    PR #45

    ?full=1&exp=EXP-07&chart=age_curve

    The whole studio: a list of every chart in the run down the left, the driver age chart and its table of exact numbers in the middle, and the question rail down the right
  2. W-02

    Right-click asks about the selection

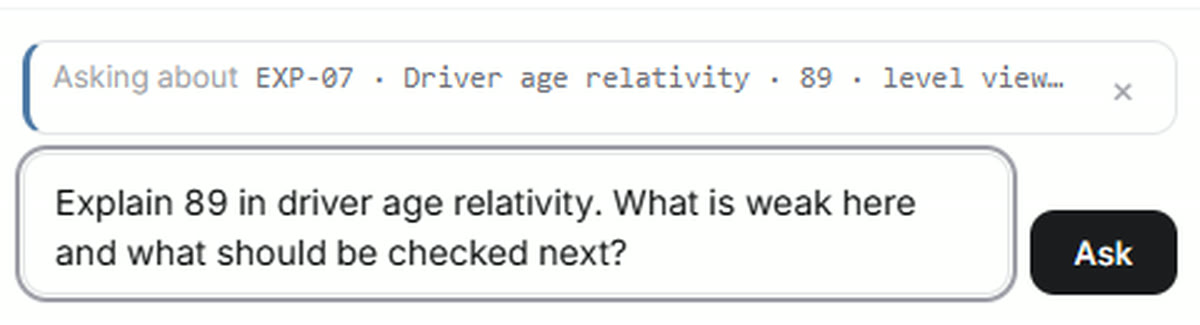
    Right-click a pinned slice. The question lands in the rail with that selection attached.
    PR #51

    ?full=1&exp=EXP-07&chart=age_curve&sel=89:89

    The question box, pre-filled by the right-click, above a grey chip reading: Asking about EXP-07, driver age relativity, 89, level view
  3. W-03

    A navigator docks the whole run

    Every chart the run produced, grouped by experiment. A coloured dot carries each verdict: blue still standing, red thrown out, green the winner.

    PR #47 · PR #50 · PR #57

    ?full=1&exp=EXP-04&chart=accidents

    NO LINK · the star pins are saved per browser, so this link carries the chart and leaves the pins behind
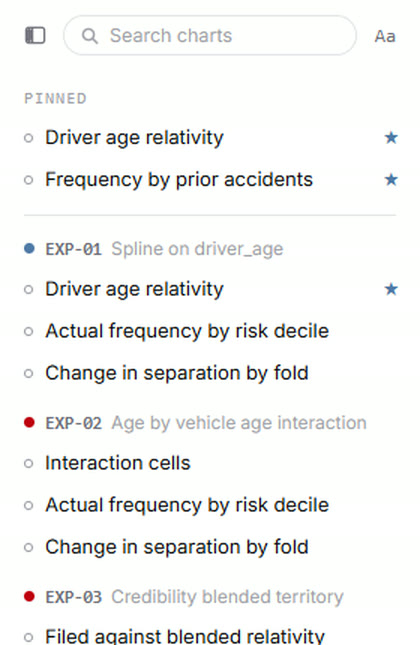
    The chart list: a pinned section on top holding two starred charts, then experiments EXP-01 through EXP-03, each with a coloured verdict dot and its own charts underneath
  4. W-04

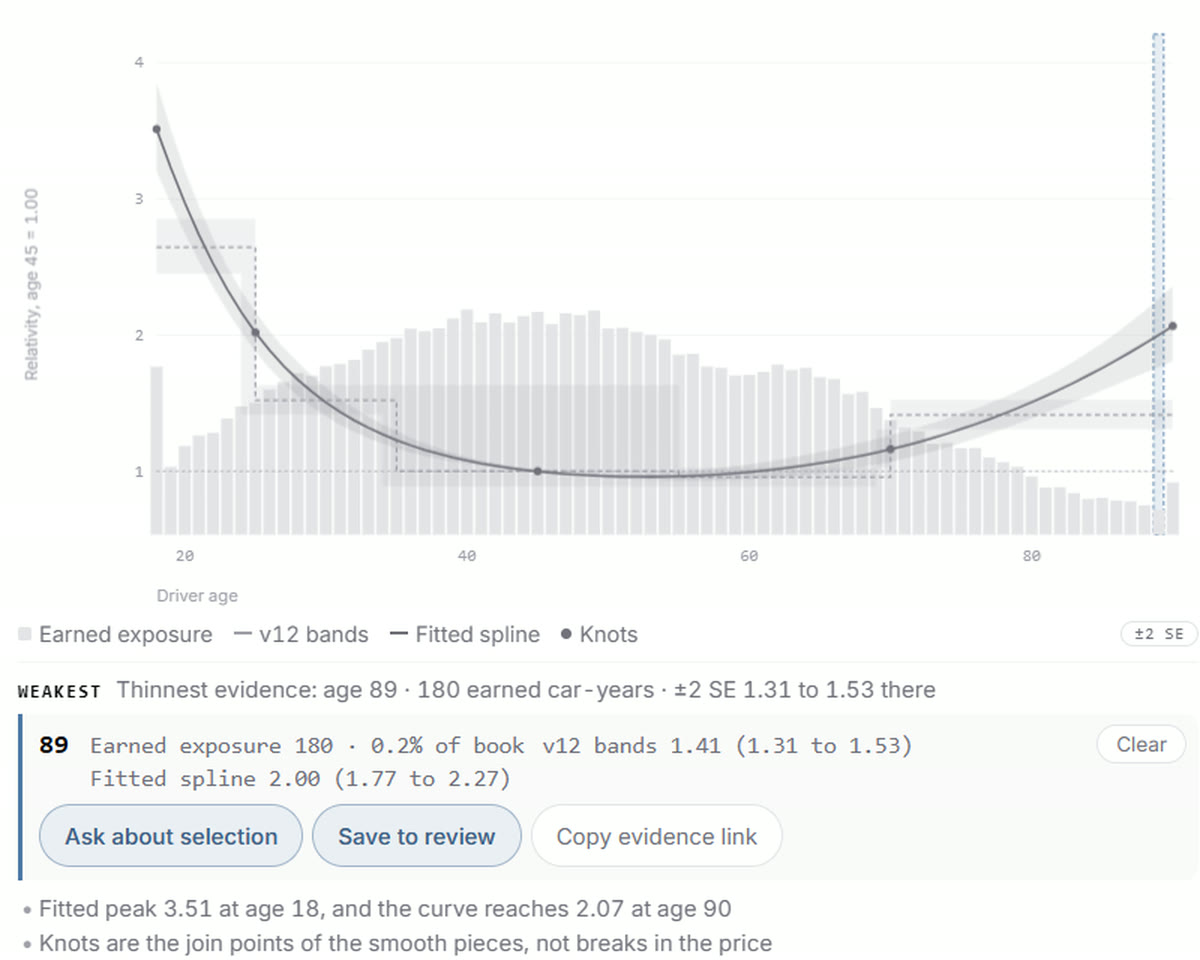
    Uncertainty is on by default

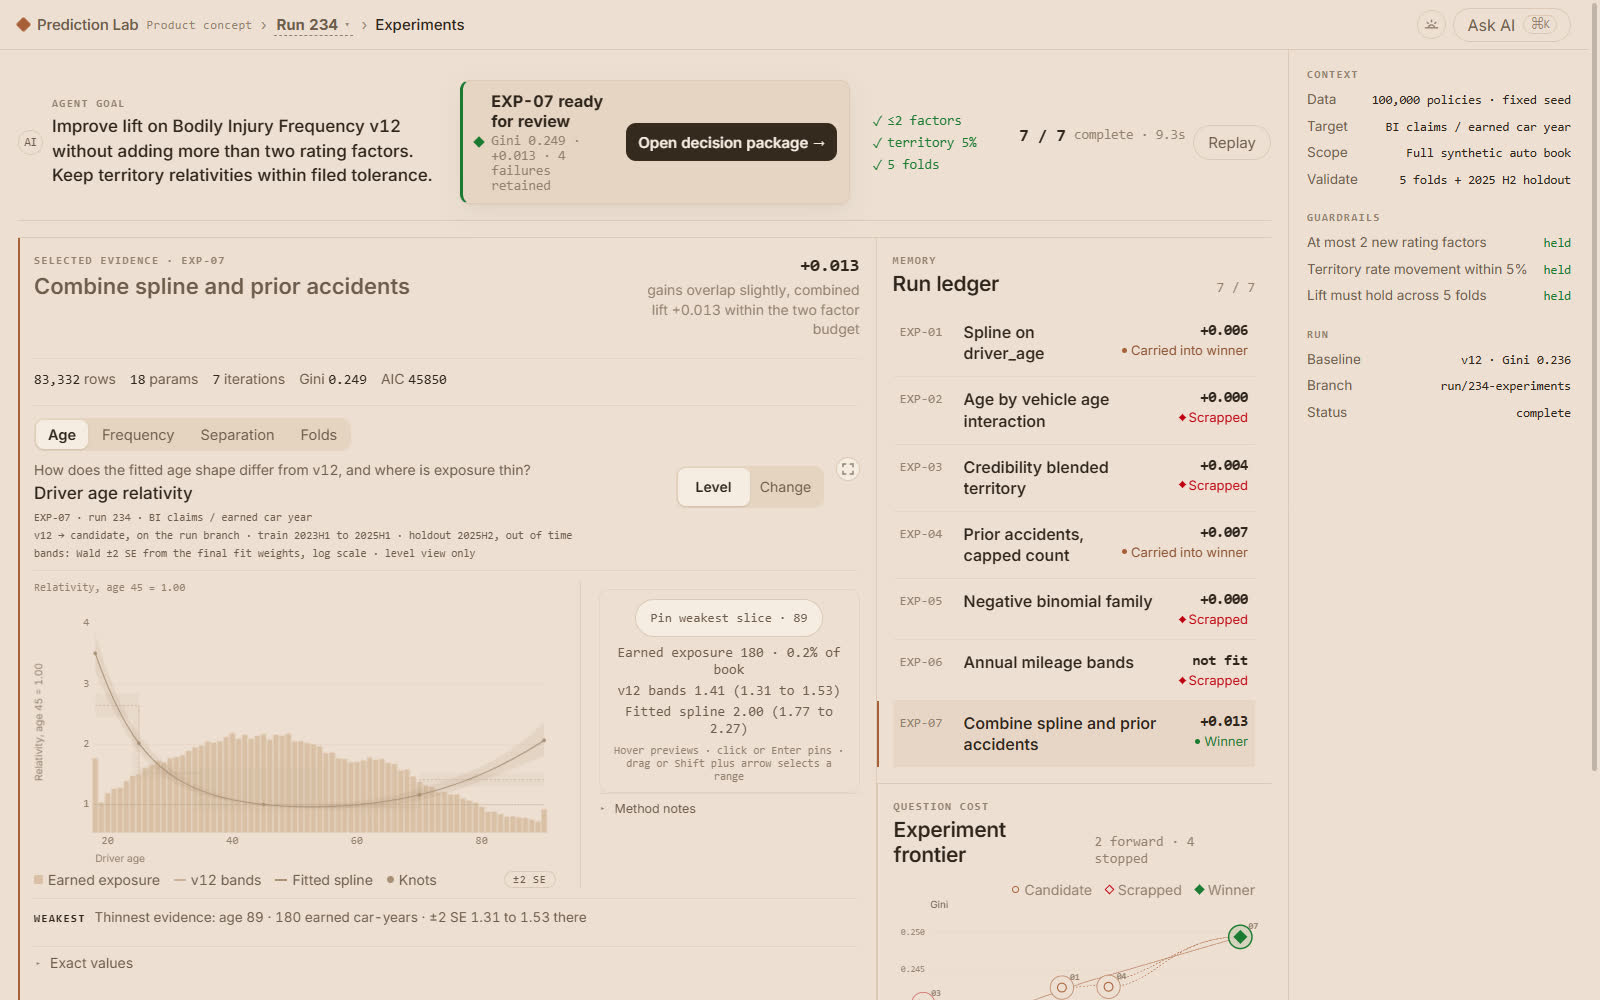
    Every chart ships with its error band, bars showing how much data sits behind each age, and a line naming the weakest point.
    PR #59

    ?full=1&exp=EXP-07&chart=age_curve&sel=89:89&tbl=off

    The fitted curve inside a shaded error band, grey bars behind it showing how much data sits at each age, and a line reading: thinnest evidence, age 89, 180 earned car-years
  5. W-05

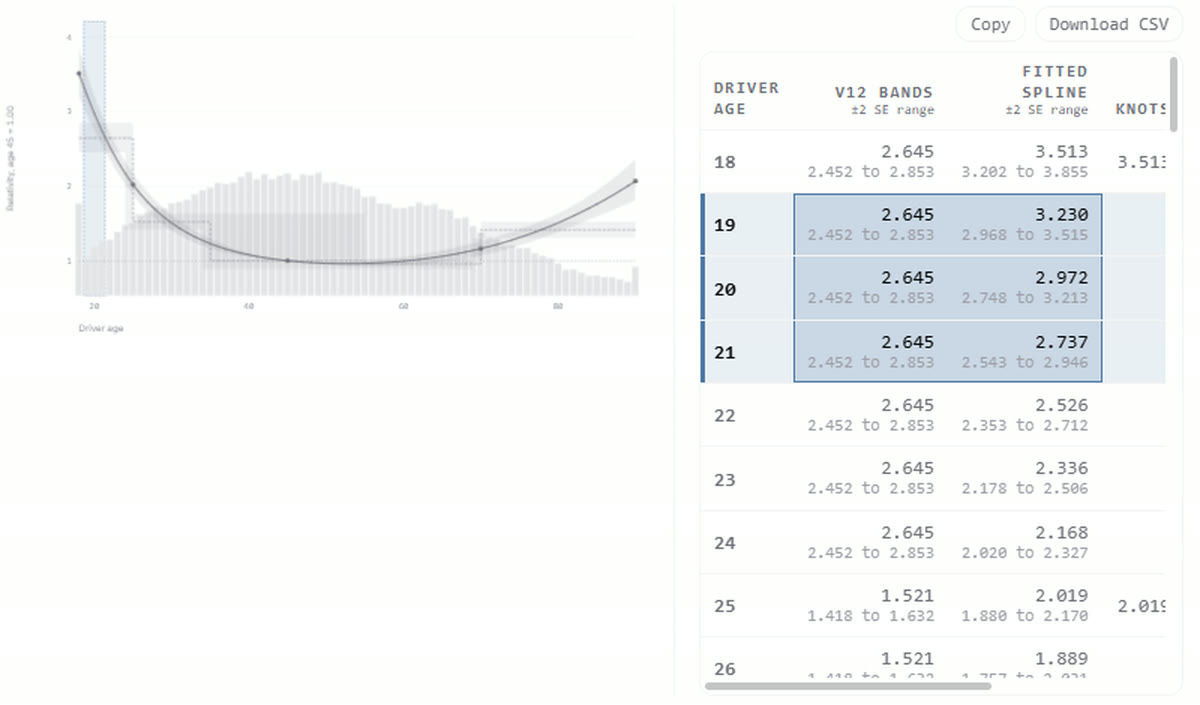
    Every chart has an exact-value twin

    A table of the same numbers sits beside the chart, below it, alone, or off. Sweeping cells moves the band on the plot, and clicking the plot lights the rows.
    PR #59 · PR #64 · PR #65 · PR #67

    ?full=1&exp=EXP-07&chart=age_curve&tbl=side&sel=19:21

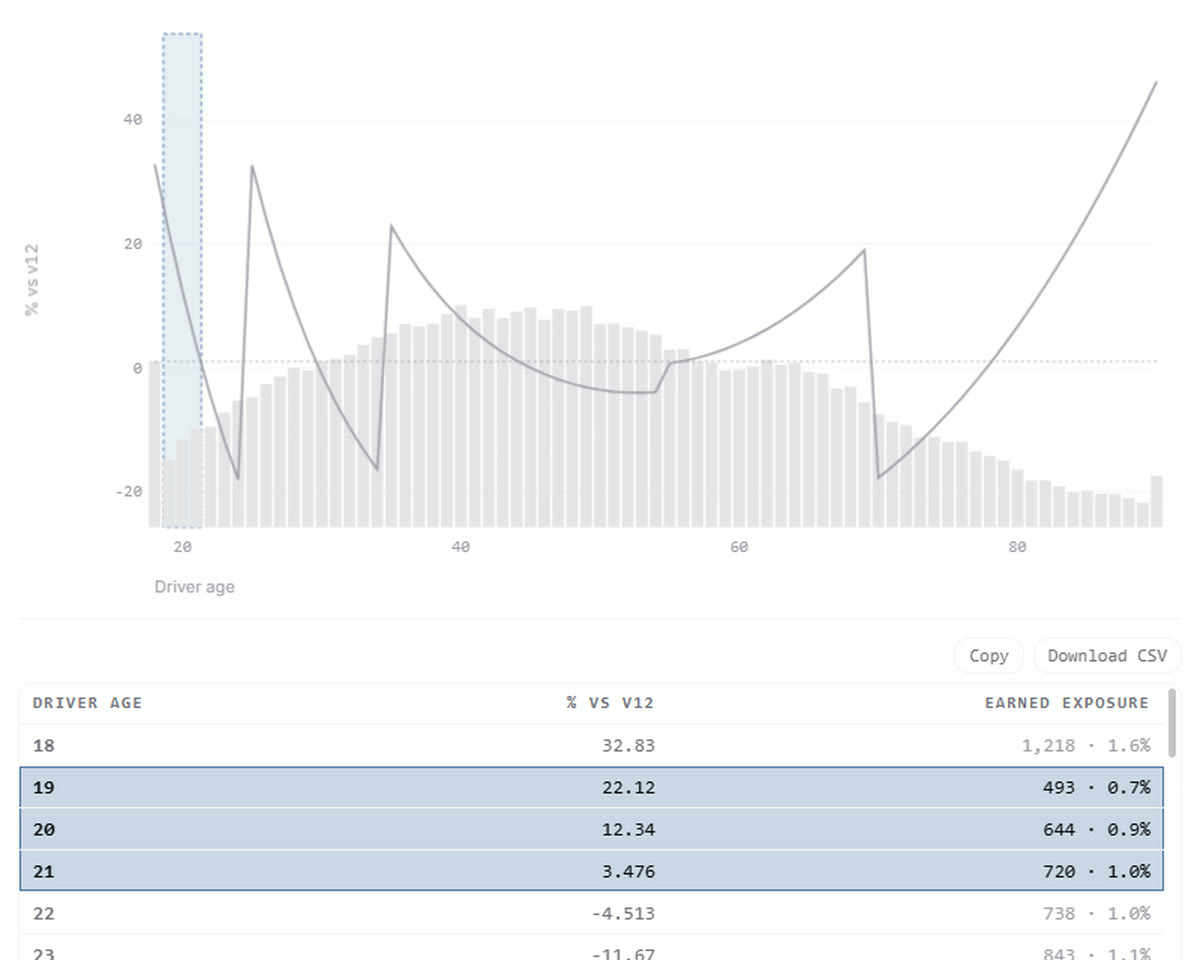
    Rows 19, 20 and 21 swept as a tinted block in the table, with the matching band drawn on the chart beside it
  6. W-06

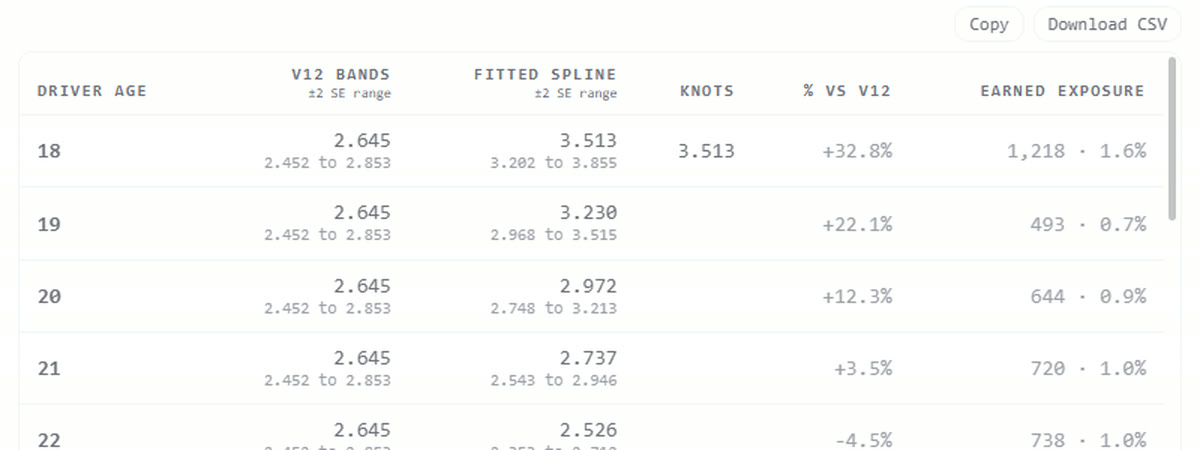
    Exports say where the numbers came from

    Copy and the CSV open with a line naming the chart, experiment, run, and model version. The file is named the same way, so a spreadsheet full of figures can still be traced back.
    PR #62 · PR #64

    ?full=1&exp=EXP-07&chart=age_curve&tbl=only

    The table standing alone, its Copy and Download CSV controls in the header above the column titles
  7. W-07

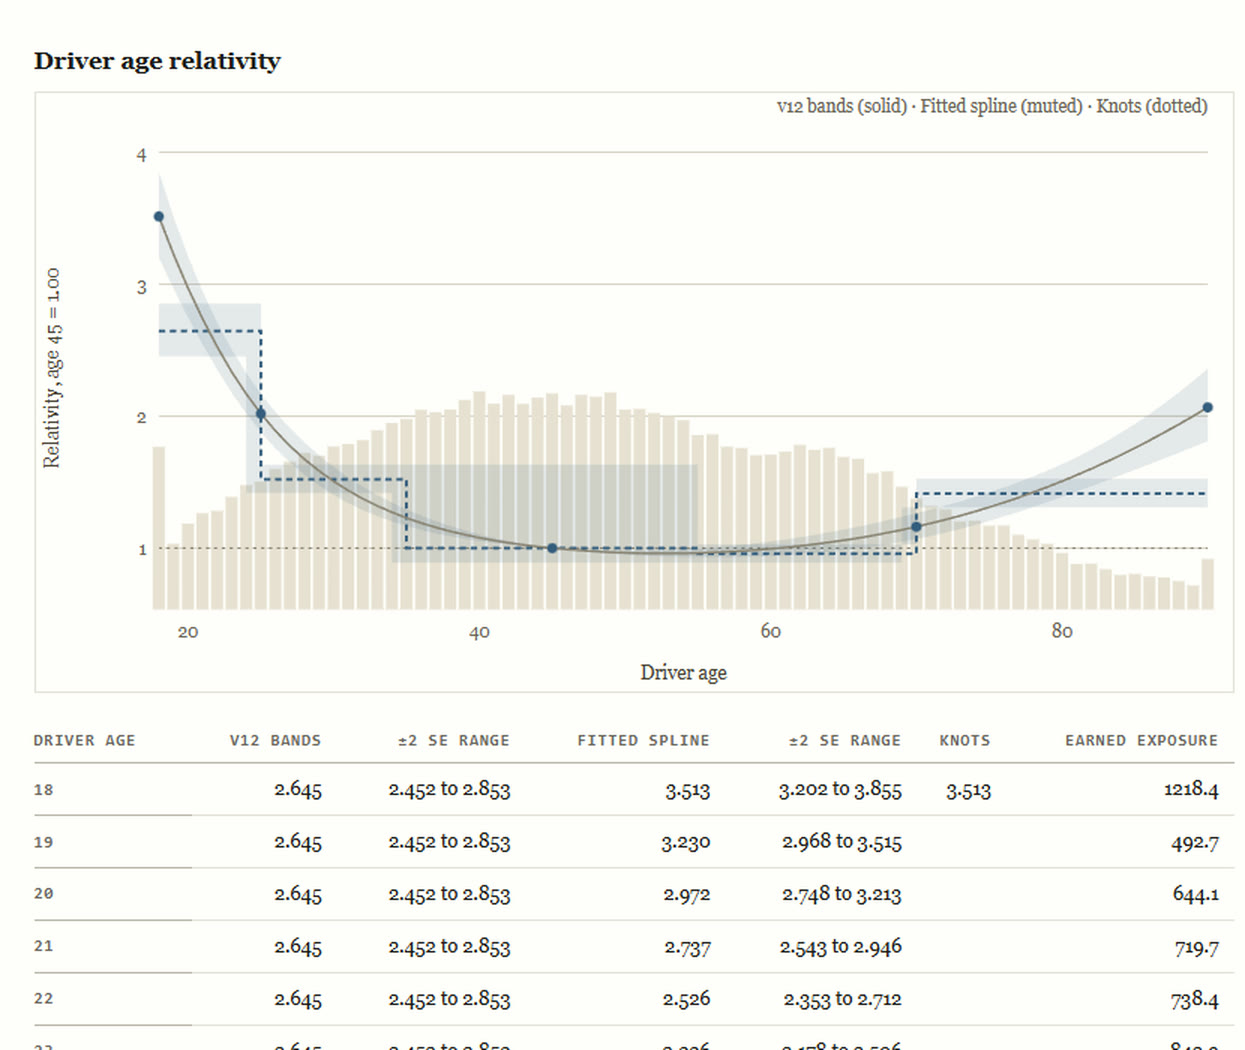
    Approval freezes the evidence

    Signing off draws the charts and their exact values once, inside the approval. The record page reprints those stored drawings.
    PR #60

    /record/234

    The decision record: the frozen driver age chart above its table of exact values, set in a print palette rather than the app one
  8. W-08

    The URL is the view

    The open studio, the chart, the selection, the table placement, and the comparison mode all ride in the link.
    PR #45 · PR #53 · PR #64 · PR #65

    ?full=1&exp=EXP-07&chart=age_curve&mode=change&sel=19:21

    The chart reopened from a cold link, showing change against v12 rather than the level view, with rows 19 to 21 still selected
  9. W-09

    Four themes, styled to the scrollbars

    Light, dark, night, gold. Each theme mixes its own scrollbar thumb.
    PR #38 · PR #39 · PR #62

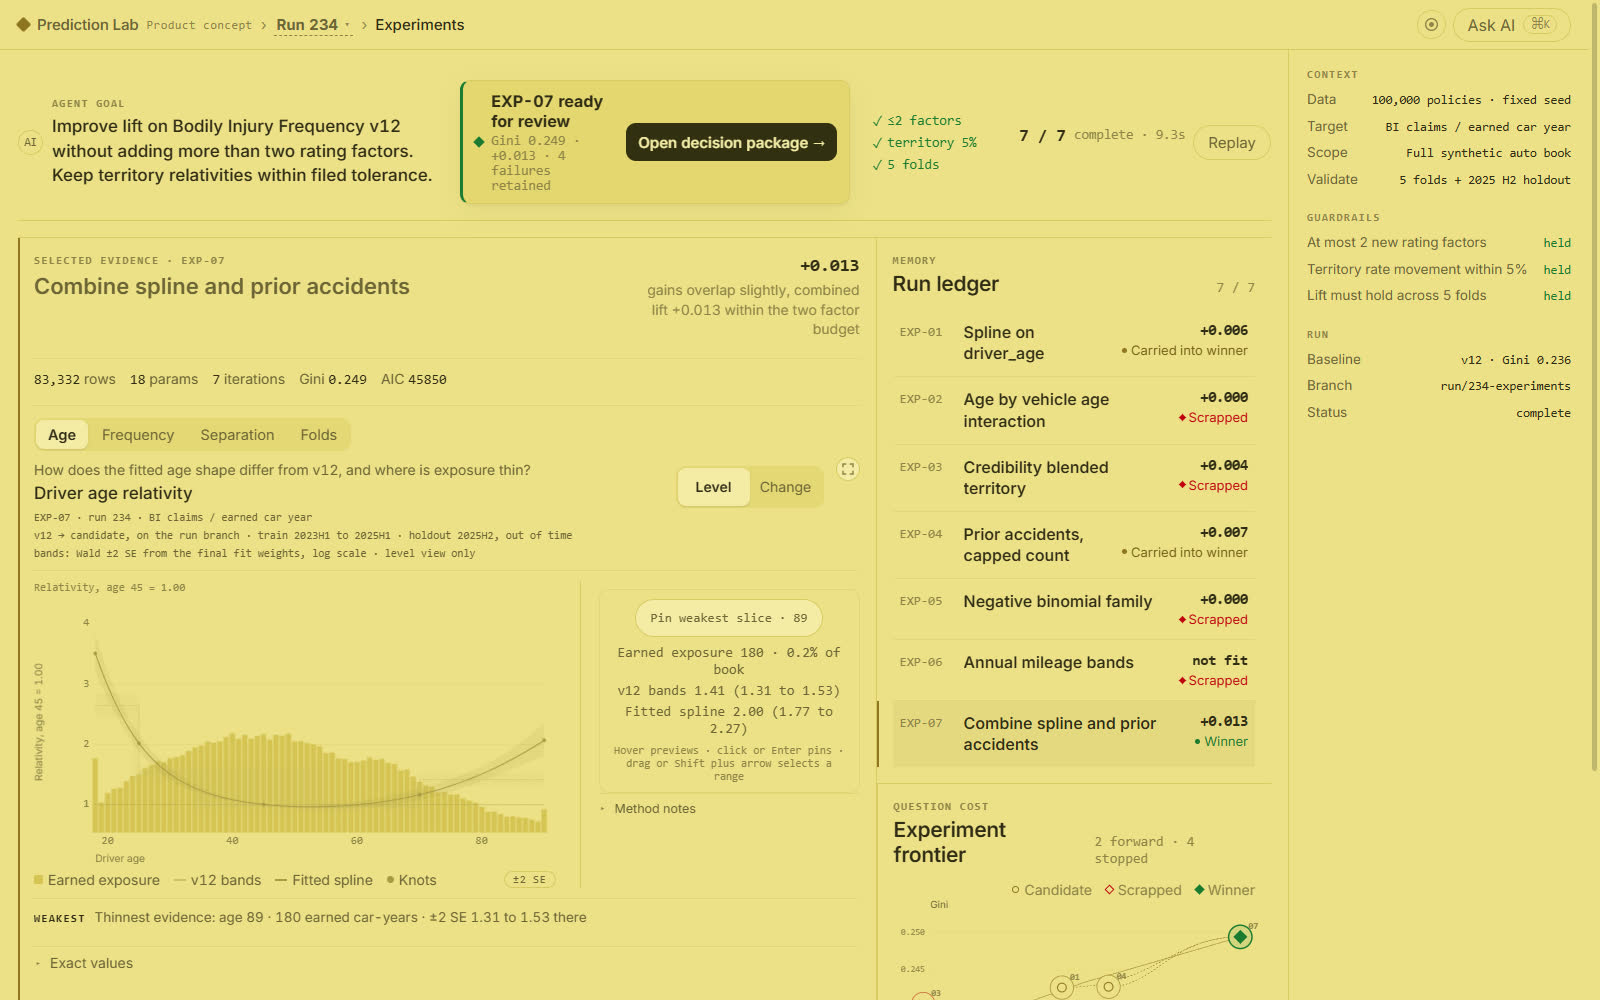
    The run overview in the gold theme: yellow ground, olive neutrals, every chart and panel restyled to matchThe same run overview in the night theme: a warm pale ground with terracotta accents